

Conclusions from a Limited Information Base (Column 663)
With God’s help
Disclaimer: This post was translated from Hebrew using AI (ChatGPT 5 Thinking), so there may be inaccuracies or nuances lost. If something seems unclear, please refer to the Hebrew original or contact us for clarification.
In this column I wish to touch on the phenomenon of drawing conclusions from surprising facts. A few weeks ago someone sent me a fascinating poll that was put to the general public on Twitter:
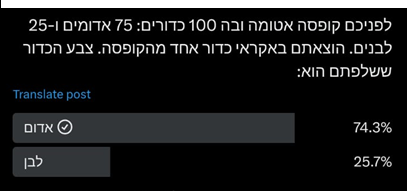
The poll asked the question above, and below it the distribution of answers is shown. Astonishingly, the answers are distributed similarly to the distribution of balls in the container. That is, 75% of respondents answered that a red ball would be drawn and 25% answered white. The opposite result was obtained for the reverse distribution (25 red balls and 75 white), meaning the match between the answer distribution and the distribution of balls in the container was preserved.
Needless to say, this result is utterly unreasonable. If you draw one ball and the experiment is conducted only once, there is no logic to assume that the ball drawn will be white. The chance of that is 25%, whereas for a red ball it is 75%. Why bet on the lower probability?
If we were to repeat the experiment many times and were asked each time to place a bet, I could perhaps understand that someone might want to bet on the minority outcome, since there would be cases where he would turn out to be right. But here we are dealing with a single-shot experiment.
Likewise, there would be some rationale if a higher payoff were offered to those who chose white and were correct. For example, if you’re told that if you chose white and white is drawn you’ll receive 100 NIS, and if you chose red and red is drawn you’ll receive 10 NIS. In such a case there is logic to choose white despite it being in the minority because of expected value (although, contrary to what you might think, it is by no means true that a rational person must choose that. That is an expected-value consideration, and in a single trial there is no necessity to act by expected value. See, for example, Column 408 and elsewhere). But here there is no payoff defined at all for the various outcomes, and so this explanation is irrelevant.
This result rather astonished me, so I asked the sender to check whether it also holds for other distributions of balls. The next experiment he sent me was this:

The accuracy is a bit lower, but there is still a fairly strong correlation. The deviations are, of course, statistically quite expected, but the trend relative to the previous experiment looks rather clear. As the number of red balls decreases (from 75 to 65) or increases (from 25 to 35), so too does the percentage of answers. The story is starting to sound troubling. It seems there is indeed an incomprehensible phenomenon that is appearing consistently.
Possible explanations
One could attribute this to the share of “fools” in the population, but it isn’t plausible that the percentage of fools changes according to the experiment. If a quarter of the population are fools, I would expect the foolish answers to always be a quarter, and not to correspond to the distribution in the container. The same is true if there is a portion of the population who think this is a repeated experiment, or an experiment with payoffs as I described above. In both such cases, too, I would expect a constant distribution rather than one that changes with the distribution of balls in the container.
Something here appears entirely illogical. Well, I had to keep investigating.
The surprise
I noticed that even in the second experiment the figures are quite close to the first. Although the trend seems to fit the change in the distribution of balls in the container, that could be coincidental. So I asked the sender for a distribution that is significantly different, and this is what I received:

Here there was a dramatic change in the distribution of balls, and the change in the answers was almost nonexistent. There was certainly no correlation with the change in distribution. It remained around a quarter versus three quarters.
The solution
The meaning is simple. There is a constant share of the population (something like 25%–32%) that gives the unreasonable answer. This could stem from stupidity, or from the other two possibilities I raised above (a misunderstanding of the experiment), although all three explanations seemed implausible to me. What is more plausible is what my daughter-in-law, Keren, suggested: that about thirty percent of the population are smart-alecks who like to give a silly answer just to be clever with the questioner. Hence we discover the same percentage in every distribution of balls. The two surprising results we saw above stemmed from the fact that the distribution of balls in those two cases was roughly around the share of smart-alecks in the population. It is possible that the person who posed the riddle did so on purpose—namely, he chose the two experiments that fit the phenomenon he wanted to demonstrate—or that he happened, by chance, to check just those two cases. Either way, there is no phenomenon here of a match between the distribution of answers and the distribution of balls in the container.
Another conclusion from these experiments
Nevertheless, there is definitely room to draw an interesting conclusion from these experiments. There is a certain percentage of smart-alecks in the population (at least the population that is accessible to that person’s Twitter and bothers to answer such questions). This too is a novel and interesting phenomenon. I would continue to examine this using various kinds of surveys (and not only of this type). It would be interesting to know whether this is stupidity or smart-aleckry, and whether it changes according to the types of questions. Incidentally, in election polling there is a known phenomenon of respondents who mislead pollsters. Pollsters have already learned to offset this phenomenon, which is why they arrive at results that are so accurate. It would be interesting to know what the percentage of such misleaders is before the offset. That too is a kind of smart-aleckry, albeit of a different sort.
Two preliminary lessons
The first conclusion is that one must not draw conclusions from isolated cases. The results could be accidental. In that sense, the three experiments I have presented here are also too few. Therefore, the conclusion about smart-alecks is also insufficiently substantiated.
Another conclusion is that small changes are not a good metric for demonstrating a phenomenon, especially if we are talking about correlation between two variables (the distribution of balls—the independent variable—versus the distribution of answers—the dependent variable). Such changes could be random. It is preferable to conduct experiments at values of the independent variable (the balls) that are very different from one another. This is what is called, in the philosophy of science, “variety of evidence.” In particular, if one sees small changes in the dependent variable (the answers, which range between 75% and 68%), one should ensure that the changes in the independent variable (the balls) are large relative to them (and that 75 versus 65 is not sufficient).
Drawing conclusions on the basis of a limited information base
The main problem in drawing conclusions from a limited base of information is that a limited base allows for a wide range of outcomes. I discussed this in Column 38.
Among other things, we saw there, for example, the mortality rate from kidney cancer in different counties in the United States. A survey found that the highest percentages were in rural areas in the Midwest. Various explanations could be proposed for this (low accessibility to health care, low levels of education, and the like), except that it then turned out that the lowest mortality rate was also found in such areas. The explanation for this is very simple. These were the sparsest areas in terms of population, and therefore the law of large numbers does not operate there. In such an area you can obtain results that differ greatly from the average. Think of an area with a single resident. If he has kidney cancer, then we have 100% morbidity. Even if we have many areas, each with ten people, there will be some in which there are three patients with kidney cancer, i.e., a morbidity rate of 30%. Conversely, there will be areas with no patients at all, and they will be considered particularly healthy.
Another example cited there was an examination of academic success in different schools, which yielded similar results: the highest success rates were found in small schools. The explanation was obvious: there is individualized attention there; the parents are affluent (they have money to send children to a small school); and so on. Following that survey, the Gates Foundation invested vast sums to reduce the number of students in schools. But then it turned out that the lowest success rates were also found in small schools. And again, there are explanations: the range of options offered by such a school is smaller than that offered by a large school. But neither type of explanation necessarily follows from the findings (though they may be true in themselves). Here too, the explanation is that with a small number of students you will obtain more varied results, farther from the average. In large schools, because of the law of large numbers, the results will be close to the average.
Another important lesson that emerges from this is that ad hoc one can explain anything. Give me a phenomenon and I will offer you an explanation. As long as you don’t test that explanation against a wide range of facts (different values of the independent variable), these explanations carry little weight. I remind you of the explanations I proposed for the ball experiment results. When such an explanation sounds very plausible to us, the situation is even more dangerous. In such a case we fall captive to our a priori assumptions and adopt that explanation, even attributing it to statistical findings. Now our “logic” has been cast in stone. It is scientific.
Daniel Kahneman calls this “the law of small numbers.” Findings based on a small set of facts and experiments that fit an explanation which seems a priori plausible to us become, in our eyes, a law of nature and a solid fact. Thus a soldier who was saved thanks to a Book of Psalms in his pocket that stopped the bullet shot at him is convinced that divine providence did it. He, of course, did not bother to check how many people were saved thanks to other books, or conversely, were harmed because they had a Book of Psalms in their pocket that deflected the bullet directly into the heart. Alternatively, think of a mother who felt a terrible premonition at exactly the moment her soldier-son was wounded at the front, and she is sure that this is telepathy or a special maternal empathy. She, of course, did not bother to check how many times she had such feelings when her son was not wounded, and how many mothers felt nothing when their son was wounded—or did not feel anything when he was, in fact, wounded—and so on. All these are examples of the law of small numbers.
Up to this point I have dealt with drawing conclusions based on a limited information base. The assumption was that the person who presented these experiments on Twitter did so in good faith, and by chance came up with surprising findings. By chance he happened to check cases that matched the percentage of smart-alecks in the population. But it is also possible that that person conducted many experiments and chose to present specifically those that matched the “matching” thesis. This is a fallacy that is also based on the latitude afforded by small samples, and it allows us to choose our factual basis in a biased manner. This is what is called “cherry picking”, a fallacy I have already touched on in the past (see, for example, Column 640, and in the Q&A here, and more).
Cherry picking
The fallacy called cherry picking is the biased selection of a subset of facts out of a larger set of facts in order to support a thesis we desire. Think of that Twitter user who wants to advance the thesis of a link between the distribution of answers and the distribution of balls. He conducted several experiments in various configurations of balls in the container. In almost all of them the distribution of answers was around 30% smart-alecks versus 70% regular respondents. Now he chooses the experiments that are around 30–70, and from among them he chooses those in which the results regarding the answers are closest to the distribution of balls in the container, in a way that demonstrates a trend in the desired direction (as in the second experiment above), and then he presents this partial sample of experiments to the public. This can convince many of us that there is indeed a correlation between the distribution of answers and the distribution of balls in the container.
This choice is called “cherry picking” because a worker engaged in picking is also asked by his employer to pick the better cherries. Moreover, when he presents the fruit he has picked to others, they will infer that this is an excellent orchard that yields superb fruit, whereas in fact many other, lower-quality fruits remain on the tree. The “cherry picking” fallacy is the selection of the facts (the fruit) we want out of the totality of facts (the fruit). A conclusion drawn from such a biased and tendentious sample is, of course, incorrect.
People engaged in pseudoscience (such as alternative medicine—see Column 38 above) and conspiracy theories tend to use cherry picking. They select quotations or successful cases to confirm various theses. When the thesis is set in advance, there is no problem finding data that will corroborate it. Oren Zarif, Nir Ben-Artzi, the oracle of Delphi, academic futurists such as David Passig, and various charlatans and conjurers, rabbis and others, rely on such cherry picking. There are a few cases in which their prediction came true—simply because of statistics—and these build for them an eternal fame as super-wizards, while people are unaware that there are no fewer cases in which they failed. It is also advisable to speak ambiguously enough so that the thesis is not falsifiable. Thus one can always fit what happened to the required thesis.
Pick a Number
I have previously brought the example from the book Pick a Number by John Verdon. I receive an envelope containing a letter and a smaller envelope. In the letter I am asked to choose a number between 1 and 1000. I am then asked to open the smaller envelope, and inside I will find precisely the number I chose. The writer goes on to say that if I am convinced he has supernatural powers, then, if I wish, I can send him $10,000 and he will make me a millionaire. Well, with a smirk I choose a number—say, 712—and when I open the envelope, to my amazement I find exactly that number inside. All right, I will save you the speculation. After investigation it turned out that the writer sent ten thousand such envelopes to ten thousand addressees, and inside each one appeared a random number between 1 and 1000. You understand that on average he will hit, in ten of the cases, the choice of the recipient. Thus he can earn $100,000, fair and square. The recipient, of course, builds the theory that the writer has supernatural powers on the basis of a biased sample (a single example). If he were able to look at all the facts, he would understand that there is no basis for his theory. In this case, the writer succeeded in presenting to some of the recipients a sample biased in favor of the thesis that he has supernatural powers.
Discover more from הרב מיכאל אברהם
Subscribe to get the latest posts sent to your email.
After the benchmark that the Rabbi set in the previous article, I sat and waited. Incidentally, in YouTube, Twitter, and all the opinion polls on Bishin, there is the option to change your choice after you know the current survey results, which is why people often "correct" their choice after seeing the results.
That, and also that sometimes you can see the survey results before you answer and they give you ideas.
I liked the mention of Pasig. Indeed, there is something in common between his and Nir Ben Artzi's 'prophecies'. Both recite a series of generic disasters: war, earthquake, plague. Then, voila, something of it comes true, and the 'future' is titled 'The Man Who Foresaw the Russian Invasion of Ukraine'.
How is this different from the physico-theological argument,
We only know one world and building a grand theory on it is really cherry picking. And what about all the disorder in creation?
I have nothing to do with such careless wording. Formulate a more specific question if you want to discuss.
Assumption A:
Information cannot be derived from a set of events that is too small.
Assumption B:
We know only one world.
Assumption C:
Conclusion One world is too small a set to discuss the possibilities of creating worlds.
Conclusion:
Nothing can be deduced from the existence of our world.
A. It is certainly possible to derive information from a small set of events. It depends on what information.
B. True.
C. Nonsense. I did not deduce this information from the world I know. The assumption that a complex thing did not come into being by itself is an assumption of reason and not the result of experience.
D. Ditto.
Can I have a translation into Hebrew?
Did you really not understand or did you not want to understand? This seems like a trivial question to me..
In my opinion, the ”wrong” answers stemmed from the revolt of some readers over the absolute wording: “What color is the ball”. As if it were possible to know.
These are wise men fighting for justice 😉
I wonder if with a different wording, such as “What is the likely color of the ball” etc., the percentage of wise men would have been different.
Excellent article. Clear and fascinating. Thank you.
There may be another type of person who may think that the questioner is trying to confuse by asking a question that seems too simple. They may think that there is a ‘catch’ here and therefore the correct answer is precisely what seems illogical.
Yes, but I would expect them to spend another second thinking and try to find out why that answer is the right one. When they don't find it, they will answer what is right. Well, all of this is speculation and is not important to my actual discussion.
I'm active on Twitter and I remember the poll in question.
I remember when I answered the poll I understood it not as a 'riddle' asking what it's better to bet on, but as a 'challenge' in which the tweeter challenges the audience to choose an answer in the poll so that the result will be according to the desired distribution.
I may be wrong, but I also read the comments and it's possible that my impression is based on them as well, I don't remember exactly.
“And some mothers didn't feel anything when their son was hurt or didn't feel it when he was hurt, etc.”
After the joke about the soldier who was saved thanks to the Book of Psalms, I didn't understand what you mean. How is it different from “mothers who didn't feel anything when their son was hurt” to those who ”didn't feel it when he was hurt”?
The reference to David Passig is interesting. He claims that his field builds a statistical model that is based on patterns drawn from the history of human behavior.
And he does not claim that this is a necessary truth, but only a very probable one, and in any case he says that the goal is to encourage humanity to take steps that will distance us from the statistics he found.
Why does this seem like common charlatanism to you? It actually sounds much more rational, even if not scientific in the full sense of the word.
As I answered you in a parallel question: It does sound wonderful, the problem is only the facts (what an annoying world. All harmonious theories shatter on the stubborn factual ground). His predictions are worth a fever. The excuse that he doesn't say it's necessary is a smear, of course. Nobody expects necessity. What I expect is statistical indicators that will show that his predictions are better than mine or yours. I don't think you'll find any, and if you do, they're biased. His predictions usually don't mean anything either, a kind of obscurity that can always be justified. A patent whose days are like the days of the Delphic oracles.
Just this morning I was wondering (so who said there's no private supervision?!), who's smarter, Oren Zarif or David Pasig. They both do exactly the same thing, except Pasig is an employee and Pasig is self-employed. Although Zarif earns more from his spells and eye-catching, Pasig received the rank and status of a professor with job security in the chair named after the Oracle of Ramat Gan, through the same spells and eye-catching.